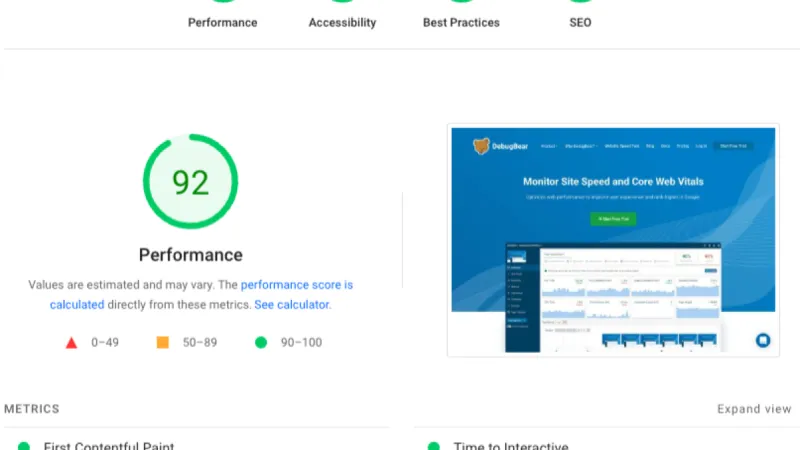
In the web development industry, there's a dangerous obsession: the perfect 100/100 score in Google PageSpeed Insights or Lighthouse. Clients demand it, agencies promise it, and developers struggle for weeks chasing those final points. But here's the brutal truth: a perfect score doesn't guarantee more sales or happier users.
The Perfect Score Myth
The Misconception
If my site has 100/100 on PageSpeed, it will be the fastest and rank better on Google.
The Harsh Reality
Google PageSpeed Insights measures your site in a simulated lab, not under your real users' conditions. A score of 100 might mean:
- Site tested with gigabit connection
- Latest generation device
- No browser extensions or ad-blockers
- No real traffic and complex interactions
In the real world, your users browse on:
- Unstable 4G from the subway
- iPhone 8 with degraded battery
- Browser with 20 active extensions
- Corporate networks with proxy and firewall
Lab scores don't reflect real experience.
Core Web Vitals vs Lighthouse Score
What Actually Matters
Google uses Core Web Vitals for ranking, not the Lighthouse score:
Largest Contentful Paint (LCP) - Must be under 2.5 seconds. Measures when main content loads. SEO impact: high.
First Input Delay (FID) / Interaction to Next Paint (INP) - FID under 100ms, INP under 200ms. Measures click responsiveness. SEO impact: medium.
Cumulative Layout Shift (CLS) - Under 0.1. Measures visual stability. SEO impact: medium.
The Critical Difference
You can have 95/100 in Lighthouse and excellent Core Web Vitals performance. Or you can have 100/100 in the lab and 4-second LCP on real devices.
Google ranks based on real experiences (Chrome User Experience Report), not simulated scores.
The Cost of Extreme Optimization
The Typical Scenario
A client comes with an 85/100 site and wants 100/100. Developers spend 40-80 hours optimizing:
What gets sacrificed:
- Functionality: Background video eliminated
- Design: Custom fonts replaced with system fonts
- UX: Aggressive lazy loading affecting experience
- Analytics: Google Analytics replaced with less accurate solutions
- Features: Chat widget, interactive maps, animations removed
What gets gained:
- 100/100 score in simulated test
- Screenshot for portfolio
- Psychological satisfaction of perfection
The critical question: Did conversions increase? Usually, no.
ROI Calculation
Scenario A: Pragmatic optimization (85-90 score)
- Cost: 10-15 hours development
- Result: LCP 2.1s, CLS 0.08, INP 150ms
- Conversion: +12% vs slow version (4s+)
- Cost: €600-900
Scenario B: 100/100 obsession
- Cost: 60-80 hours development
- Result: LCP 1.8s, CLS 0.05, INP 120ms
- Conversion: +14% (only 2% more than Scenario A)
- Cost: €3,600-4,800
- Incremental cost per conversion point: €1,500-1,950
For 2% conversion improvement, you pay 4-5 times more. In most cases, this money would be better invested in UX research, A/B testing, or new features.
When Optimization Becomes Counter-Productive
Real Industry Examples
Case 1: E-commerce with 100/100 score but zero sales An online store eliminated all high-resolution images, product videos, and interactive zoom for a perfect score. Result: bounce rate +35%, conversion -22%. Users couldn't properly evaluate products.
Case 2: Corporate site that eliminated its personality A creative agency replaced all animations, custom fonts, and background videos with minimalist design for 100/100. Result: time on site -40%, leads -18%. The site looked generic and no longer reflected the brand.
Case 3: Blog with excessive progressive loading A tech blog implemented lazy loading so aggressively that images appeared on scroll with visible delay. Score: 98/100. User feedback: "the site feels broken".
Red Flags: When to Stop
Stop optimizing when:
- You're eliminating elements essential to user experience
- You're sacrificing branding for milliseconds
- You're spending more time optimizing than developing features
- Real tests (Google Search Console) show good results
- Bounce rate increases as score improves
- Conversion stagnates or decreases
What Actually Matters: Business Metrics
Measure Real Impact
Instead of obsessing over scores, track:
Time to Interactive (TTI) - When users can effectively interact. Target: under 3.5 seconds on 4G.
Bounce Rate by Speed - Compare bounce rate for users with loading under 2s vs over 4s.
Conversion Rate by Device - Desktop vs mobile vs tablet. Identify real bottlenecks.
Revenue per Second of Load Time - Directly correlate speed with revenue. Amazon: +100ms = -1% sales.
User Frustration Metrics - Rage clicks, JavaScript errors, AJAX timeouts.
A/B Testing: The Only Valid Method
Test real impact:
- Variant A: Current site (85/100)
- Variant B: Optimized site (95/100)
- Variant C: Ultra-optimized site (100/100)
Measure:
- Conversion
- Revenue per visitor
- Pages per session
- User satisfaction (survey)
Often, Variant B wins. Rarely is it worth going to Variant C.
Optimizations That Actually Matter
Smart Prioritization
Invest time in optimizations with real ROI:
- Images: Compression and modern formats
- WebP/AVIF instead of JPEG/PNG
- Responsive images (srcset)
- CDN for delivery
- Impact: 40-60% payload reduction, +10-15 points
- Critical CSS: Above-the-fold styling inline
- Extract CSS for visible content
- Defer non-critical CSS
- Impact: LCP -0.5-1s, +5-10 points
- JavaScript: Code splitting and lazy loading
- Split at route level
- Dynamic imports for optional features
- Impact: TTI -1-2s, +10-15 points
- Font Loading: FOUT vs FOIT strategies
- font-display: swap for custom fonts
- Preload for critical fonts
- Fallback to system fonts
- Impact: CLS -0.05-0.1, +5 points
- Server Response Time: TTFB optimization
- CDN for static assets
- Server-side caching (Redis, Varnish)
- Database query optimization
- Impact: TTFB from 800ms to 200ms
The Diminishing Returns Threshold
After making the above optimizations, benefits decline dramatically:
- 0-70 points: Major improvements, minimal effort
- 70-85 points: Good improvements, reasonable effort
- 85-95 points: Marginal improvements, significant effort
- 95-100 points: Imperceptible improvements, massive effort
Stop between 85-95 and focus on something else.
Cases When 100/100 Is Justified
Valid Exceptions
There are situations when a perfect score actually matters:
Landing pages for ads - Cost per click is high, every millisecond directly influences conversion rate. Clearly measurable ROI.
Sites with massive traffic (1M+ visitors/month) - 0.1s optimizations mean massive server cost savings and significant conversion impact at high volume.
Core Web Vitals below threshold - If your site is red in Search Console (LCP over 4s), then yes, it needs aggressive optimization. You risk SEO penalties.
Extreme SEO competition - In ultra-competitive niches (e.g., insurance, legal), every ranking factor counts. Speed can be the differentiator.
Media publications - News sites with tens of millions of monthly views directly benefit from bandwidth savings and ad revenue per impression.
The Balanced Approach: Speed Budget
Implementing a Performance Budget
Instead of a perfect score, establish realistic budgets:
JavaScript Budget
- Max 170KB for initial bundle
- Max 50KB per additional route
- Monitoring with Bundlephobia
Image Budget
- Hero images: max 200KB (WebP)
- Thumbnails: max 30KB
- Total images per page: max 1.5MB
Third-Party Scripts Budget
- Max 3 external scripts (analytics, chat, etc.)
- Max 100KB total third-party
- Async or defer loading mandatory
Time Budget
- LCP: max 2.5s (75th percentile)
- FID/INP: max 200ms
- CLS: max 0.1
- TTI: max 3.8s on 4G
These budgets are measurable, realistic, and directly correlate with user experience.
Tools for Real Measurement
Beyond Lighthouse
Use tools that measure real performance:
Google Search Console - Core Web Vitals report based on real users. The only source of truth for SEO.
WebPageTest - Test from diverse locations and devices. Filmstrip view shows what users see.
Chrome User Experience Report (CrUX) - Aggregated data from millions of Chrome users. Public dataset in BigQuery.
Real User Monitoring (RUM)
- Sentry Performance
- New Relic Browser
- Datadog RUM
- Cloudflare Web Analytics (free, privacy-friendly)
Synthetic Monitoring
- Pingdom
- GTmetrix
- Uptime Robot with performance checks
Custom Metrics for Your Business
Define metrics relevant to your industry:
E-commerce: Time to Add to Cart - When the "Add to Cart" button becomes active. Target: under 1.5s.
Media: Time to First Headline - When the first headline becomes readable. Target: under 1s.
SaaS: Time to Interactive Form - When users can complete the signup form. Target: under 2s.
Conclusion: Performance Is a Means, Not an End
The obsession with a 100/100 score is a classic example of optimizing for the wrong metric. Instead of focusing on an arbitrary number from a lab test, focus on:
Real user experience - Measure with RUM, not just simulations.
Measurable business impact - Conversion, revenue, engagement. Performance must serve these objectives.
Balance between speed and features - A fast but useless site serves no one.
ROI of optimizations - Every development hour must be justified by impact.
The "fast enough" threshold - After LCP under 2.5s and CLS under 0.1, invest elsewhere.
Site performance is like nutrition: there's a healthy optimum, but obsession with perfection becomes counter-productive. A site with 90/100 that converts clients and offers excellent experience is worth infinitely more than a sterile, rigid 100/100.
The question isn't "How do I reach 100/100?" but "What performance level best serves my business objectives?". Most often, the answer is somewhere between 85-95 points, focusing on real Core Web Vitals and user experience.
Invest in performance, but invest intelligently. Track metrics that matter. And remember: your users don't see the PageSpeed score. They only feel whether the site is fast, useful, and pleasant to use.